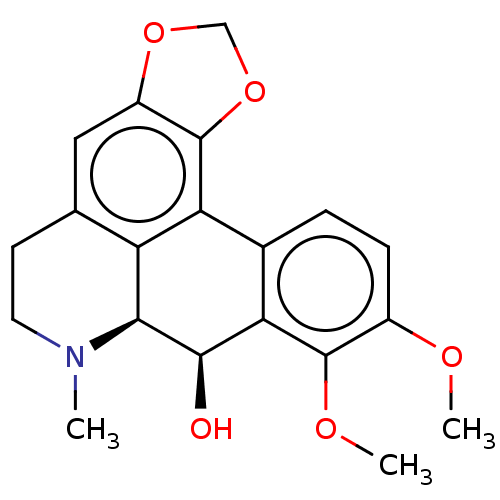
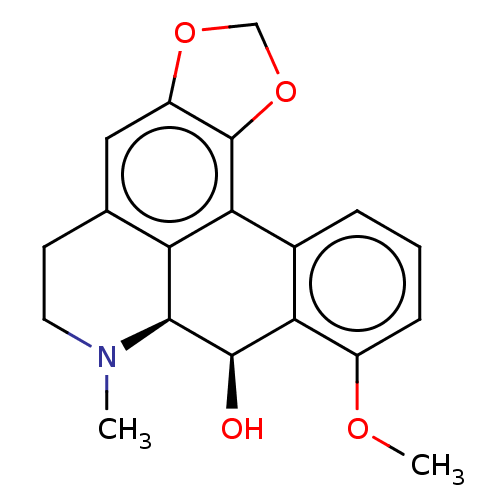
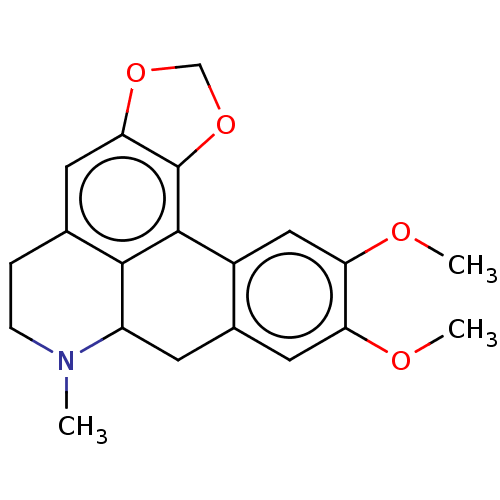
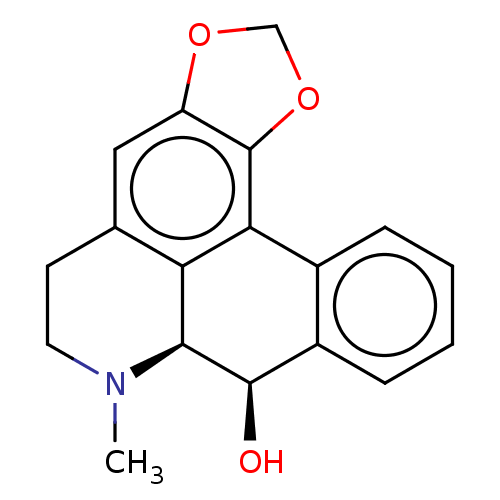
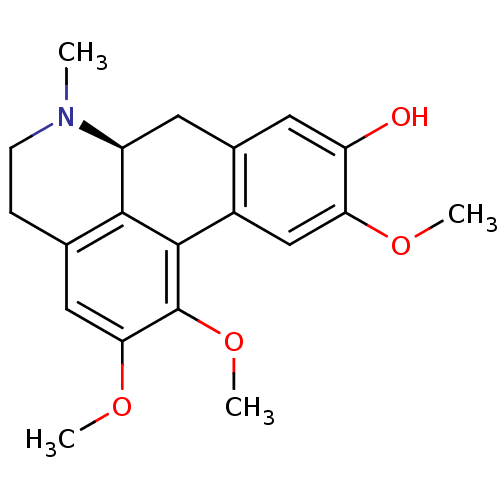
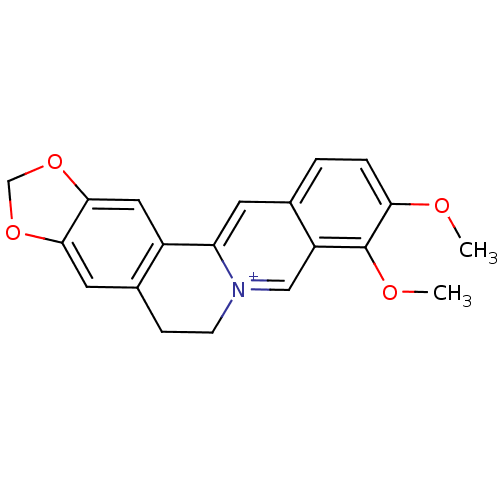
Report error Found 45 Enz. Inhib. hit(s) with all data for entry = 50020404
Affinity DataKi: 1.80nMAssay Description:Displacement of [3H]8-OH-DPAT from human 5-HT1A assessed as inhibition constantMore data for this Ligand-Target Pair
Affinity DataKi: 3.80nMAssay Description:Displacement of [3H]5-HT from rat 5-HT7 assessed as inhibition constantMore data for this Ligand-Target Pair
Affinity DataKi: 4.30nMAssay Description:Displacement of [3H]5-HT from rat 5-HT7 assessed as inhibition constantMore data for this Ligand-Target Pair
Affinity DataKi: 6.90nMAssay Description:Displacement of [3H]5-HT from rat 5-HT7 assessed as inhibition constantMore data for this Ligand-Target Pair
Affinity DataKi: 9.80nMAssay Description:Displacement of [3H]5-HT from rat 5-HT7 assessed as inhibition constantMore data for this Ligand-Target Pair
Affinity DataKi: 13nMAssay Description:Displacement of [3H]5-HT from rat 5-HT7 assessed as inhibition constantMore data for this Ligand-Target Pair
Affinity DataKi: 41nMAssay Description:Displacement of [3H]8-OH-DPAT from human 5-HT1A assessed as inhibition constantMore data for this Ligand-Target Pair
Affinity DataKi: 62nMAssay Description:Displacement of [3H]8-OH-DPAT from human 5-HT1A assessed as inhibition constantMore data for this Ligand-Target Pair
Affinity DataKi: 142nMAssay Description:Displacement of [3H]8-OH-DPAT from human 5-HT1A assessed as inhibition constantMore data for this Ligand-Target Pair
Affinity DataIC50: 149nMAssay Description:Inhibition of human 5-HT2C stably transfected in HEK293T cells measured after 1 hrs by FLIPR assayMore data for this Ligand-Target Pair
Affinity DataKi: 554nMAssay Description:Displacement of [3H]8-OH-DPAT from human 5-HT1A assessed as inhibition constantMore data for this Ligand-Target Pair
Affinity DataIC50: 564nMAssay Description:Inhibition of human 5-HT2A stably transfected in HEK293T cells measured after 1 hrs by FLIPR assayMore data for this Ligand-Target Pair
Affinity DataIC50: 1.09E+3nMAssay Description:Inhibition of Electrophorus electricus AChE using ATCI as substrate pre-incubated for 10 mins followed by substrate addition measured after 5 mins by...More data for this Ligand-Target Pair
Affinity DataIC50: 1.21E+3nMAssay Description:Inhibition of Electrophorus electricus AChE using ATCI as substrate pre-incubated for 10 mins followed by substrate addition measured after 5 mins by...More data for this Ligand-Target Pair
Affinity DataIC50: 1.69E+3nMAssay Description:Inhibition of human 5-HT2B stably transfected in HEK293T cells measured after 1 hrs by FLIPR assayMore data for this Ligand-Target Pair
Affinity DataIC50: 2.80E+3nMAssay Description:Inhibition of equine serum BuChE using BTCI as substrate pre-incubated for 10 mins followed by substrate addition measured after 5 mins by microplate...More data for this Ligand-Target Pair
Affinity DataIC50: 2.80E+3nMAssay Description:Inhibition of equine serum BuChE using BTCI as substrate pre-incubated for 10 mins followed by substrate addition measured after 5 mins by microplate...More data for this Ligand-Target Pair
Affinity DataIC50: 2.85E+3nMAssay Description:Inhibition of Electrophorus electricus AChE using ATCI as substrate pre-incubated for 10 mins followed by substrate addition measured after 5 mins by...More data for this Ligand-Target Pair
Affinity DataIC50: 3.26E+3nMAssay Description:Inhibition of equine serum BuChE using BTCI as substrate pre-incubated for 10 mins followed by substrate addition measured after 5 mins by microplate...More data for this Ligand-Target Pair
Affinity DataIC50: 3.34E+3nMAssay Description:Inhibition of equine serum BuChE using BTCI as substrate pre-incubated for 10 mins followed by substrate addition measured after 5 mins by microplate...More data for this Ligand-Target Pair
Affinity DataIC50: 4.30E+3nMAssay Description:Inhibition of Electrophorus electricus AChE using ATCI as substrate pre-incubated for 10 mins followed by substrate addition measured after 5 mins by...More data for this Ligand-Target Pair
Affinity DataIC50: 5.57E+3nMAssay Description:Inhibition of equine serum BuChE using BTCI as substrate pre-incubated for 10 mins followed by substrate addition measured after 5 mins by microplate...More data for this Ligand-Target Pair
Affinity DataIC50: 5.87E+3nMAssay Description:Inhibition of equine serum BuChE using BTCI as substrate pre-incubated for 10 mins followed by substrate addition measured after 5 mins by microplate...More data for this Ligand-Target Pair
Affinity DataIC50: 6.11E+3nMAssay Description:Inhibition of Electrophorus electricus AChE using ATCI as substrate pre-incubated for 10 mins followed by substrate addition measured after 5 mins by...More data for this Ligand-Target Pair
Affinity DataIC50: 6.12E+3nMAssay Description:Inhibition of Electrophorus electricus AChE using ATCI as substrate pre-incubated for 10 mins followed by substrate addition measured after 5 mins by...More data for this Ligand-Target Pair
Affinity DataIC50: 7.42E+3nMAssay Description:Inhibition of equine serum BuChE using BTCI as substrate pre-incubated for 10 mins followed by substrate addition measured after 5 mins by microplate...More data for this Ligand-Target Pair
Affinity DataIC50: 8.32E+3nMAssay Description:Inhibition of Electrophorus electricus AChE using ATCI as substrate pre-incubated for 10 mins followed by substrate addition measured after 5 mins by...More data for this Ligand-Target Pair
Affinity DataIC50: 1.01E+4nMAssay Description:Inhibition of equine serum BuChE using BTCI as substrate pre-incubated for 10 mins followed by substrate addition measured after 5 mins by microplate...More data for this Ligand-Target Pair
Affinity DataIC50: 1.05E+4nMAssay Description:Inhibition of Electrophorus electricus AChE using ATCI as substrate pre-incubated for 10 mins followed by substrate addition measured after 5 mins by...More data for this Ligand-Target Pair
Affinity DataIC50: 1.13E+4nMAssay Description:Inhibition of Electrophorus electricus AChE using ATCI as substrate pre-incubated for 10 mins followed by substrate addition measured after 5 mins by...More data for this Ligand-Target Pair
Affinity DataIC50: 1.19E+4nMAssay Description:Inhibition of Electrophorus electricus AChE using ATCI as substrate pre-incubated for 10 mins followed by substrate addition measured after 5 mins by...More data for this Ligand-Target Pair
Affinity DataIC50: 1.41E+4nMAssay Description:Inhibition of equine serum BuChE using BTCI as substrate pre-incubated for 10 mins followed by substrate addition measured after 5 mins by microplate...More data for this Ligand-Target Pair
Affinity DataIC50: 1.66E+4nMAssay Description:Inhibition of equine serum BuChE using BTCI as substrate pre-incubated for 10 mins followed by substrate addition measured after 5 mins by microplate...More data for this Ligand-Target Pair
Affinity DataIC50: 1.74E+4nMAssay Description:Inhibition of equine serum BuChE using BTCI as substrate pre-incubated for 10 mins followed by substrate addition measured after 5 mins by microplate...More data for this Ligand-Target Pair
Affinity DataIC50: 1.76E+4nMAssay Description:Inhibition of Electrophorus electricus AChE using ATCI as substrate pre-incubated for 10 mins followed by substrate addition measured after 5 mins by...More data for this Ligand-Target Pair
Affinity DataIC50: 2.03E+4nMAssay Description:Inhibition of equine serum BuChE using BTCI as substrate pre-incubated for 10 mins followed by substrate addition measured after 5 mins by microplate...More data for this Ligand-Target Pair
Affinity DataIC50: 2.25E+4nMAssay Description:Inhibition of equine serum BuChE using BTCI as substrate pre-incubated for 10 mins followed by substrate addition measured after 5 mins by microplate...More data for this Ligand-Target Pair
Affinity DataIC50: 2.64E+4nMAssay Description:Inhibition of equine serum BuChE using BTCI as substrate pre-incubated for 10 mins followed by substrate addition measured after 5 mins by microplate...More data for this Ligand-Target Pair
Affinity DataIC50: 3.25E+4nMAssay Description:Inhibition of Electrophorus electricus AChE using ATCI as substrate pre-incubated for 10 mins followed by substrate addition measured after 5 mins by...More data for this Ligand-Target Pair
Affinity DataIC50: 3.98E+4nMAssay Description:Inhibition of Electrophorus electricus AChE using ATCI as substrate pre-incubated for 10 mins followed by substrate addition measured after 5 mins by...More data for this Ligand-Target Pair
Affinity DataIC50: 1.04E+5nMAssay Description:Inhibition of equine serum BuChE using BTCI as substrate pre-incubated for 10 mins followed by substrate addition measured after 5 mins by microplate...More data for this Ligand-Target Pair
Affinity DataIC50: 1.35E+5nMAssay Description:Inhibition of POP (unknown origin) using ZGP-AMC as substrate pre treated for 5 mins followed by substrate addition measured after 30 mins by ELISA a...More data for this Ligand-Target Pair
Affinity DataIC50: 1.41E+5nMAssay Description:Inhibition of Electrophorus electricus AChE using ATCI as substrate pre-incubated for 10 mins followed by substrate addition measured after 5 mins by...More data for this Ligand-Target Pair
Affinity DataIC50: 1.42E+5nMAssay Description:Inhibition of POP (unknown origin) using ZGP-AMC as substrate pre treated for 5 mins followed by substrate addition measured after 30 mins by ELISA a...More data for this Ligand-Target Pair
Affinity DataIC50: 1.47E+5nMAssay Description:Inhibition of Electrophorus electricus AChE using ATCI as substrate pre-incubated for 10 mins followed by substrate addition measured after 5 mins by...More data for this Ligand-Target Pair
