Report error Found 590 Enz. Inhib. hit(s) with all data for entry = 10488
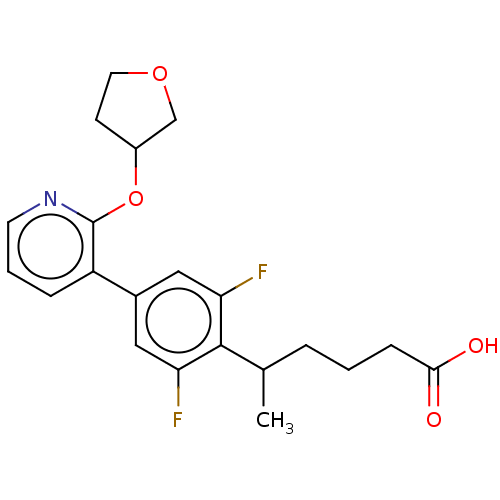
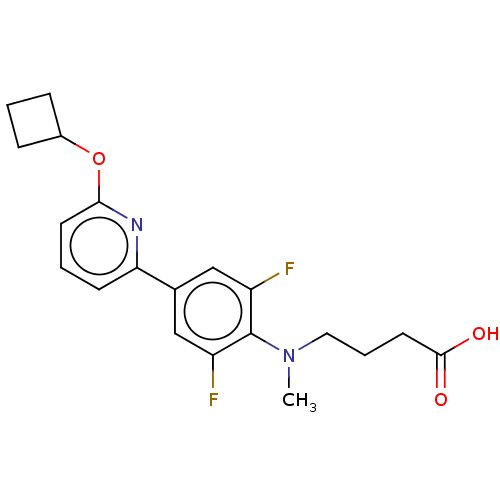
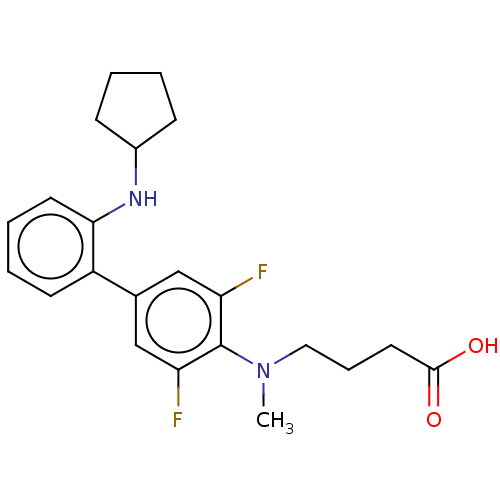
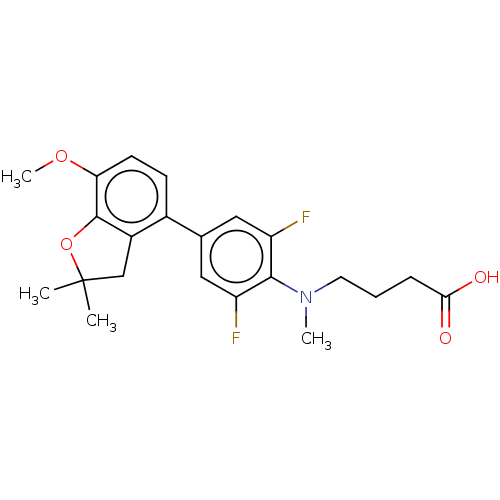
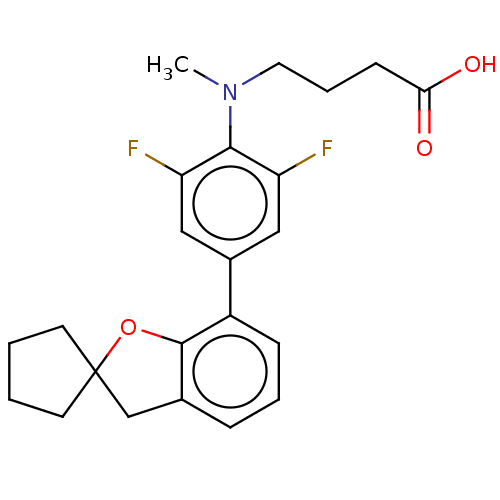
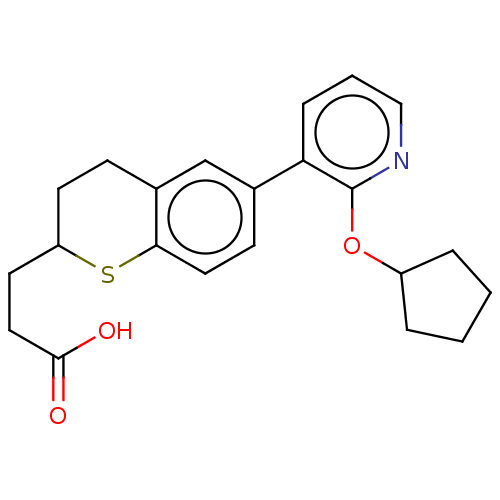
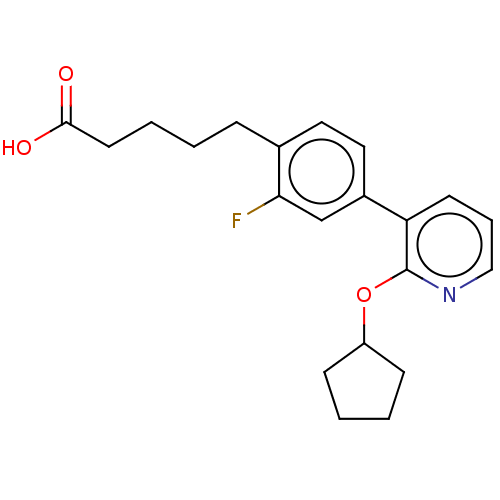
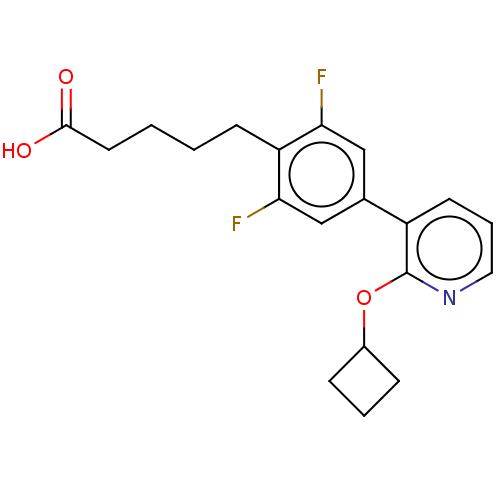
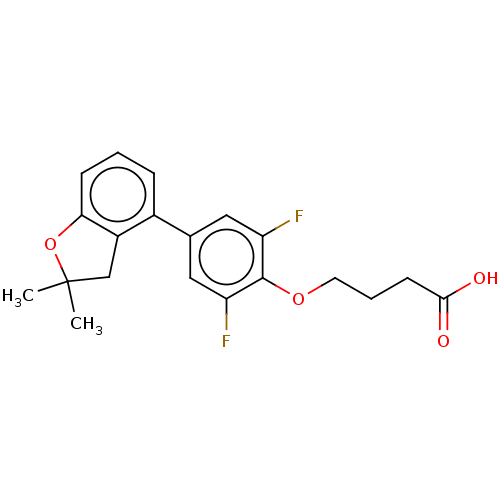
Affinity DataEC50: <200nMAssay Description:CHO-K1 cells expressing Ga16 and hGPR120 were dispensed into each well of a 96-well plate (3×10⁴ cells/100 μl/well) and then incubated in 5% CO2...More data for this Ligand-Target Pair
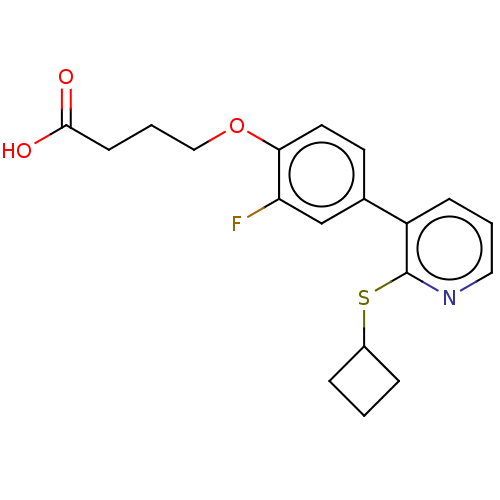
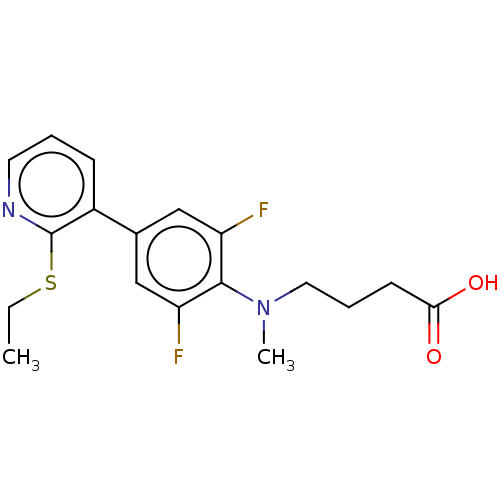
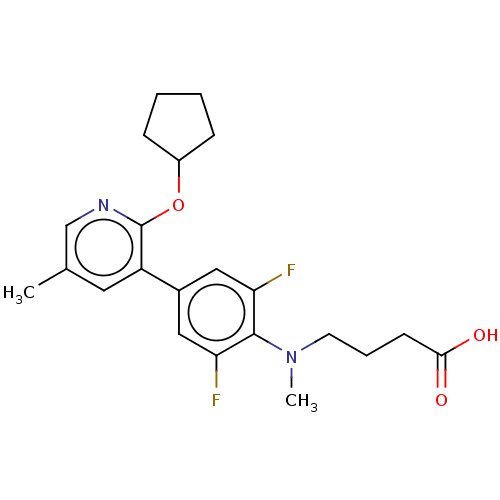
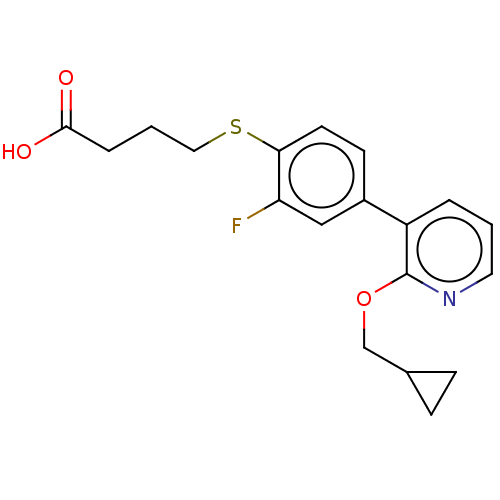
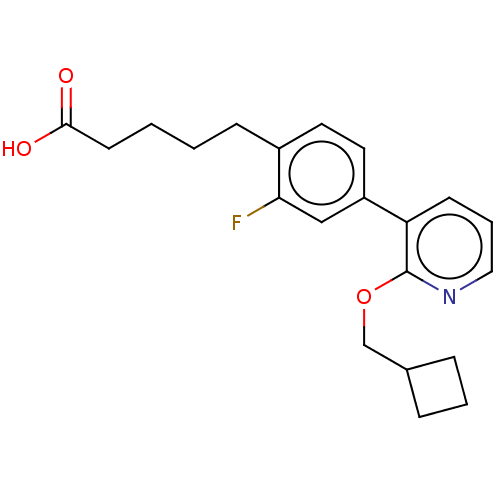
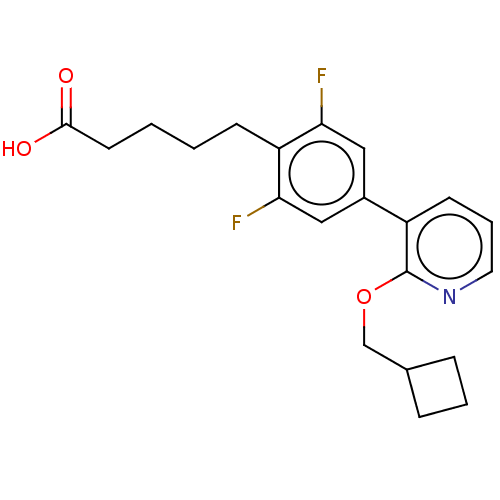
Affinity DataEC50: <200nMAssay Description:CHO-K1 cells expressing Ga16 and hGPR120 were dispensed into each well of a 96-well plate (3×10⁴ cells/100 μl/well) and then incubated in 5% CO2...More data for this Ligand-Target Pair

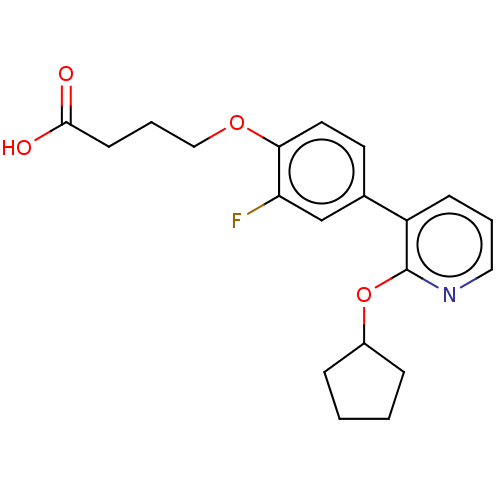
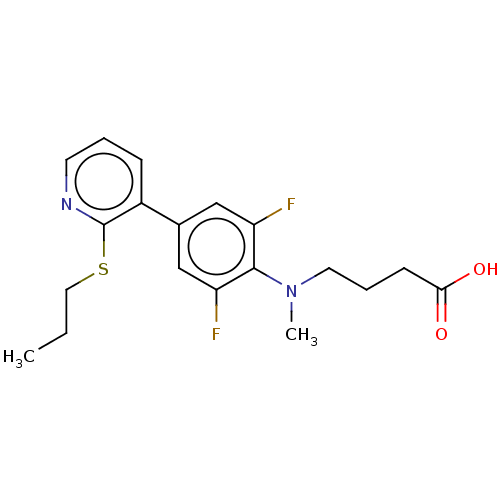
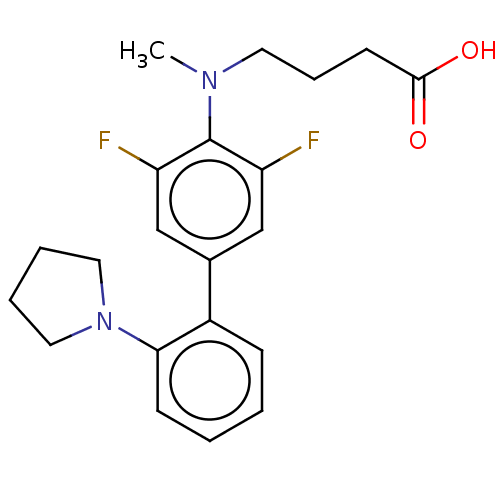
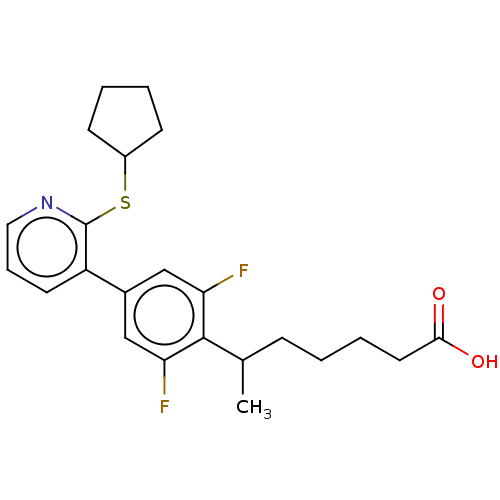
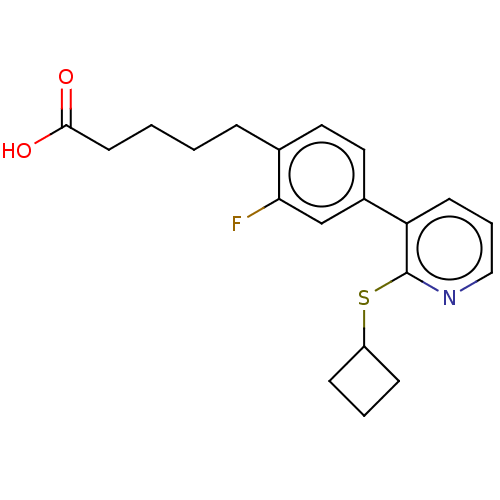
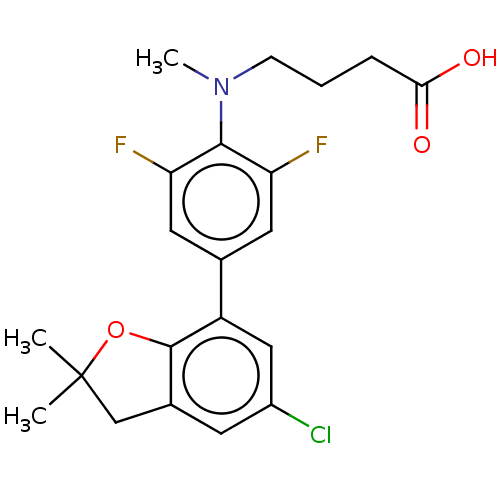
Affinity DataEC50: <200nMAssay Description:CHO-K1 cells expressing Ga16 and hGPR120 were dispensed into each well of a 96-well plate (3×10⁴ cells/100 μl/well) and then incubated in 5% CO2...More data for this Ligand-Target Pair
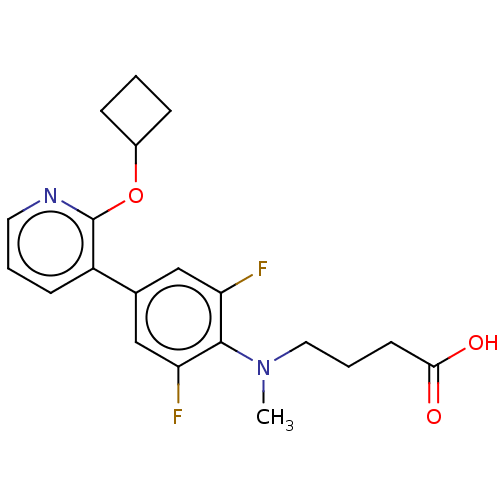
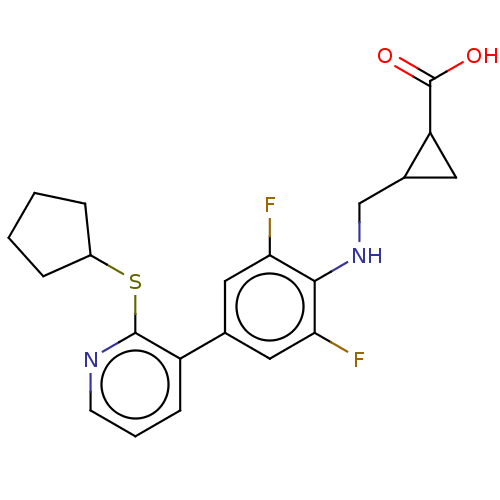
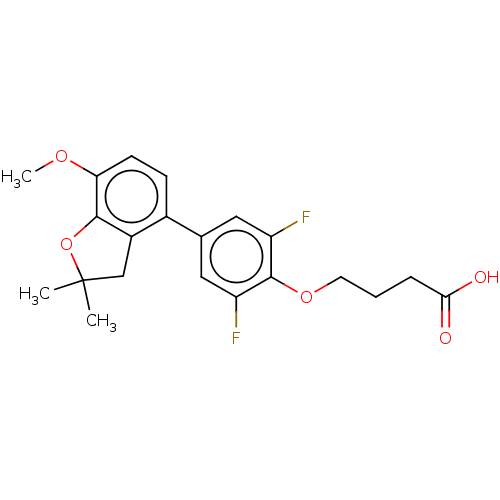
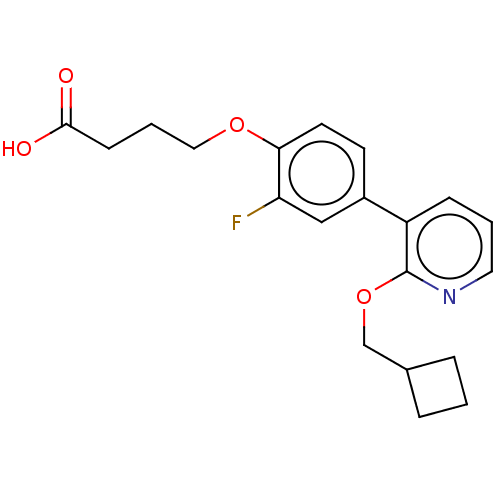
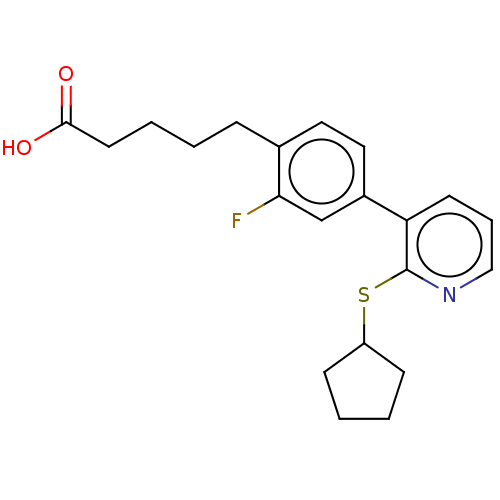
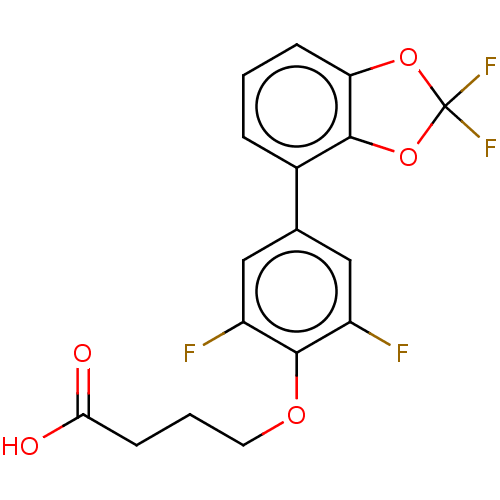
Affinity DataEC50: <200nMAssay Description:CHO-K1 cells expressing Ga16 and hGPR120 were dispensed into each well of a 96-well plate (3×10⁴ cells/100 μl/well) and then incubated in 5% CO2...More data for this Ligand-Target Pair
Affinity DataEC50: <200nMAssay Description:CHO-K1 cells expressing Ga16 and hGPR120 were dispensed into each well of a 96-well plate (3×10⁴ cells/100 μl/well) and then incubated in 5% CO2...More data for this Ligand-Target Pair
Affinity DataEC50: <200nMAssay Description:CHO-K1 cells expressing Ga16 and hGPR120 were dispensed into each well of a 96-well plate (3×10⁴ cells/100 μl/well) and then incubated in 5% CO2...More data for this Ligand-Target Pair
Affinity DataEC50: <200nMAssay Description:CHO-K1 cells expressing Ga16 and hGPR120 were dispensed into each well of a 96-well plate (3×10⁴ cells/100 μl/well) and then incubated in 5% CO2...More data for this Ligand-Target Pair
Affinity DataEC50: <200nMAssay Description:CHO-K1 cells expressing Ga16 and hGPR120 were dispensed into each well of a 96-well plate (3×10⁴ cells/100 μl/well) and then incubated in 5% CO2...More data for this Ligand-Target Pair

Affinity DataEC50: <200nMAssay Description:CHO-K1 cells expressing Ga16 and hGPR120 were dispensed into each well of a 96-well plate (3×10⁴ cells/100 μl/well) and then incubated in 5% CO2...More data for this Ligand-Target Pair

Affinity DataEC50: <200nMAssay Description:CHO-K1 cells expressing Ga16 and hGPR120 were dispensed into each well of a 96-well plate (3×10⁴ cells/100 μl/well) and then incubated in 5% CO2...More data for this Ligand-Target Pair
Affinity DataEC50: <200nMAssay Description:CHO-K1 cells expressing Ga16 and hGPR120 were dispensed into each well of a 96-well plate (3×10⁴ cells/100 μl/well) and then incubated in 5% CO2...More data for this Ligand-Target Pair
Affinity DataEC50: <200nMAssay Description:CHO-K1 cells expressing Ga16 and hGPR120 were dispensed into each well of a 96-well plate (3×10⁴ cells/100 μl/well) and then incubated in 5% CO2...More data for this Ligand-Target Pair
Affinity DataEC50: <200nMAssay Description:CHO-K1 cells expressing Ga16 and hGPR120 were dispensed into each well of a 96-well plate (3×10⁴ cells/100 μl/well) and then incubated in 5% CO2...More data for this Ligand-Target Pair
Affinity DataEC50: <200nMAssay Description:CHO-K1 cells expressing Ga16 and hGPR120 were dispensed into each well of a 96-well plate (3×10⁴ cells/100 μl/well) and then incubated in 5% CO2...More data for this Ligand-Target Pair
Affinity DataEC50: <200nMAssay Description:CHO-K1 cells expressing Ga16 and hGPR120 were dispensed into each well of a 96-well plate (3×10⁴ cells/100 μl/well) and then incubated in 5% CO2...More data for this Ligand-Target Pair
Affinity DataEC50: <200nMAssay Description:CHO-K1 cells expressing Ga16 and hGPR120 were dispensed into each well of a 96-well plate (3×10⁴ cells/100 μl/well) and then incubated in 5% CO2...More data for this Ligand-Target Pair
Affinity DataEC50: <200nMAssay Description:CHO-K1 cells expressing Ga16 and hGPR120 were dispensed into each well of a 96-well plate (3×10⁴ cells/100 μl/well) and then incubated in 5% CO2...More data for this Ligand-Target Pair
Affinity DataEC50: <200nMAssay Description:CHO-K1 cells expressing Ga16 and hGPR120 were dispensed into each well of a 96-well plate (3×10⁴ cells/100 μl/well) and then incubated in 5% CO2...More data for this Ligand-Target Pair
Affinity DataEC50: <200nMAssay Description:CHO-K1 cells expressing Ga16 and hGPR120 were dispensed into each well of a 96-well plate (3×10⁴ cells/100 μl/well) and then incubated in 5% CO2...More data for this Ligand-Target Pair
Affinity DataEC50: <200nMAssay Description:CHO-K1 cells expressing Ga16 and hGPR120 were dispensed into each well of a 96-well plate (3×10⁴ cells/100 μl/well) and then incubated in 5% CO2...More data for this Ligand-Target Pair

Affinity DataEC50: <200nMAssay Description:CHO-K1 cells expressing Ga16 and hGPR120 were dispensed into each well of a 96-well plate (3×10⁴ cells/100 μl/well) and then incubated in 5% CO2...More data for this Ligand-Target Pair
Affinity DataEC50: <200nMAssay Description:CHO-K1 cells expressing Ga16 and hGPR120 were dispensed into each well of a 96-well plate (3×10⁴ cells/100 μl/well) and then incubated in 5% CO2...More data for this Ligand-Target Pair
Affinity DataEC50: <200nMAssay Description:CHO-K1 cells expressing Ga16 and hGPR120 were dispensed into each well of a 96-well plate (3×10⁴ cells/100 μl/well) and then incubated in 5% CO2...More data for this Ligand-Target Pair
Affinity DataEC50: <200nMAssay Description:CHO-K1 cells expressing Ga16 and hGPR120 were dispensed into each well of a 96-well plate (3×10⁴ cells/100 μl/well) and then incubated in 5% CO2...More data for this Ligand-Target Pair
Affinity DataEC50: <200nMAssay Description:CHO-K1 cells expressing Ga16 and hGPR120 were dispensed into each well of a 96-well plate (3×10⁴ cells/100 μl/well) and then incubated in 5% CO2...More data for this Ligand-Target Pair
Affinity DataEC50: <200nMAssay Description:CHO-K1 cells expressing Ga16 and hGPR120 were dispensed into each well of a 96-well plate (3×10⁴ cells/100 μl/well) and then incubated in 5% CO2...More data for this Ligand-Target Pair
Affinity DataEC50: <200nMAssay Description:CHO-K1 cells expressing Ga16 and hGPR120 were dispensed into each well of a 96-well plate (3×10⁴ cells/100 μl/well) and then incubated in 5% CO2...More data for this Ligand-Target Pair
Affinity DataEC50: <200nMAssay Description:CHO-K1 cells expressing Ga16 and hGPR120 were dispensed into each well of a 96-well plate (3×10⁴ cells/100 μl/well) and then incubated in 5% CO2...More data for this Ligand-Target Pair
Affinity DataEC50: <200nMAssay Description:CHO-K1 cells expressing Ga16 and hGPR120 were dispensed into each well of a 96-well plate (3×10⁴ cells/100 μl/well) and then incubated in 5% CO2...More data for this Ligand-Target Pair
Affinity DataEC50: <200nMAssay Description:CHO-K1 cells expressing Ga16 and hGPR120 were dispensed into each well of a 96-well plate (3×10⁴ cells/100 μl/well) and then incubated in 5% CO2...More data for this Ligand-Target Pair
Affinity DataEC50: <200nMAssay Description:CHO-K1 cells expressing Ga16 and hGPR120 were dispensed into each well of a 96-well plate (3×10⁴ cells/100 μl/well) and then incubated in 5% CO2...More data for this Ligand-Target Pair
Affinity DataEC50: <200nMAssay Description:CHO-K1 cells expressing Ga16 and hGPR120 were dispensed into each well of a 96-well plate (3×10⁴ cells/100 μl/well) and then incubated in 5% CO2...More data for this Ligand-Target Pair
Affinity DataEC50: <200nMAssay Description:CHO-K1 cells expressing Ga16 and hGPR120 were dispensed into each well of a 96-well plate (3×10⁴ cells/100 μl/well) and then incubated in 5% CO2...More data for this Ligand-Target Pair
Affinity DataEC50: <200nMAssay Description:CHO-K1 cells expressing Ga16 and hGPR120 were dispensed into each well of a 96-well plate (3×10⁴ cells/100 μl/well) and then incubated in 5% CO2...More data for this Ligand-Target Pair
Affinity DataEC50: <200nMAssay Description:CHO-K1 cells expressing Ga16 and hGPR120 were dispensed into each well of a 96-well plate (3×10⁴ cells/100 μl/well) and then incubated in 5% CO2...More data for this Ligand-Target Pair
Affinity DataEC50: <200nMAssay Description:CHO-K1 cells expressing Ga16 and hGPR120 were dispensed into each well of a 96-well plate (3×10⁴ cells/100 μl/well) and then incubated in 5% CO2...More data for this Ligand-Target Pair

Affinity DataEC50: <200nMAssay Description:CHO-K1 cells expressing Ga16 and hGPR120 were dispensed into each well of a 96-well plate (3×10⁴ cells/100 μl/well) and then incubated in 5% CO2...More data for this Ligand-Target Pair
Affinity DataEC50: <200nMAssay Description:CHO-K1 cells expressing Ga16 and hGPR120 were dispensed into each well of a 96-well plate (3×10⁴ cells/100 μl/well) and then incubated in 5% CO2...More data for this Ligand-Target Pair

Affinity DataEC50: <200nMAssay Description:CHO-K1 cells expressing Ga16 and hGPR120 were dispensed into each well of a 96-well plate (3×10⁴ cells/100 μl/well) and then incubated in 5% CO2...More data for this Ligand-Target Pair
Affinity DataEC50: <200nMAssay Description:CHO-K1 cells expressing Ga16 and hGPR120 were dispensed into each well of a 96-well plate (3×10⁴ cells/100 μl/well) and then incubated in 5% CO2...More data for this Ligand-Target Pair
Affinity DataEC50: <200nMAssay Description:CHO-K1 cells expressing Ga16 and hGPR120 were dispensed into each well of a 96-well plate (3×10⁴ cells/100 μl/well) and then incubated in 5% CO2...More data for this Ligand-Target Pair
Affinity DataEC50: <200nMAssay Description:CHO-K1 cells expressing Ga16 and hGPR120 were dispensed into each well of a 96-well plate (3×10⁴ cells/100 μl/well) and then incubated in 5% CO2...More data for this Ligand-Target Pair
Affinity DataEC50: <200nMAssay Description:CHO-K1 cells expressing Ga16 and hGPR120 were dispensed into each well of a 96-well plate (3×10⁴ cells/100 μl/well) and then incubated in 5% CO2...More data for this Ligand-Target Pair
Affinity DataEC50: <200nMAssay Description:CHO-K1 cells expressing Ga16 and hGPR120 were dispensed into each well of a 96-well plate (3×10⁴ cells/100 μl/well) and then incubated in 5% CO2...More data for this Ligand-Target Pair

Affinity DataEC50: <200nMAssay Description:CHO-K1 cells expressing Ga16 and hGPR120 were dispensed into each well of a 96-well plate (3×10⁴ cells/100 μl/well) and then incubated in 5% CO2...More data for this Ligand-Target Pair
Affinity DataEC50: <200nMAssay Description:CHO-K1 cells expressing Ga16 and hGPR120 were dispensed into each well of a 96-well plate (3×10⁴ cells/100 μl/well) and then incubated in 5% CO2...More data for this Ligand-Target Pair
Affinity DataEC50: <200nMAssay Description:CHO-K1 cells expressing Ga16 and hGPR120 were dispensed into each well of a 96-well plate (3×10⁴ cells/100 μl/well) and then incubated in 5% CO2...More data for this Ligand-Target Pair
Affinity DataEC50: <200nMAssay Description:CHO-K1 cells expressing Ga16 and hGPR120 were dispensed into each well of a 96-well plate (3×10⁴ cells/100 μl/well) and then incubated in 5% CO2...More data for this Ligand-Target Pair
Affinity DataEC50: <200nMAssay Description:CHO-K1 cells expressing Ga16 and hGPR120 were dispensed into each well of a 96-well plate (3×10⁴ cells/100 μl/well) and then incubated in 5% CO2...More data for this Ligand-Target Pair
Affinity DataEC50: <200nMAssay Description:CHO-K1 cells expressing Ga16 and hGPR120 were dispensed into each well of a 96-well plate (3×10⁴ cells/100 μl/well) and then incubated in 5% CO2...More data for this Ligand-Target Pair